2. Built Up Index Map
Have more questions? Contact hello@atlasai.co
Product Description
A scaled estimate of the extent of human presence in each 100 square meter unit area, inferred from buildings. Denoted by a decimal percentage between 0 and 1 indicating how much of the 10meter x 10meter grid cell is covered by buildings.
Product Information
Data type: Float32
Min/max values: 0 (min), 1 (max)
Value definitions: 0 (no building coverage), 1 (complete building coverage)
Spatial representation: Raster grid
Spatial resolution: 10m x 10m
CRS: EPSG:4326
Vintage: 2021
Visualization Guidance
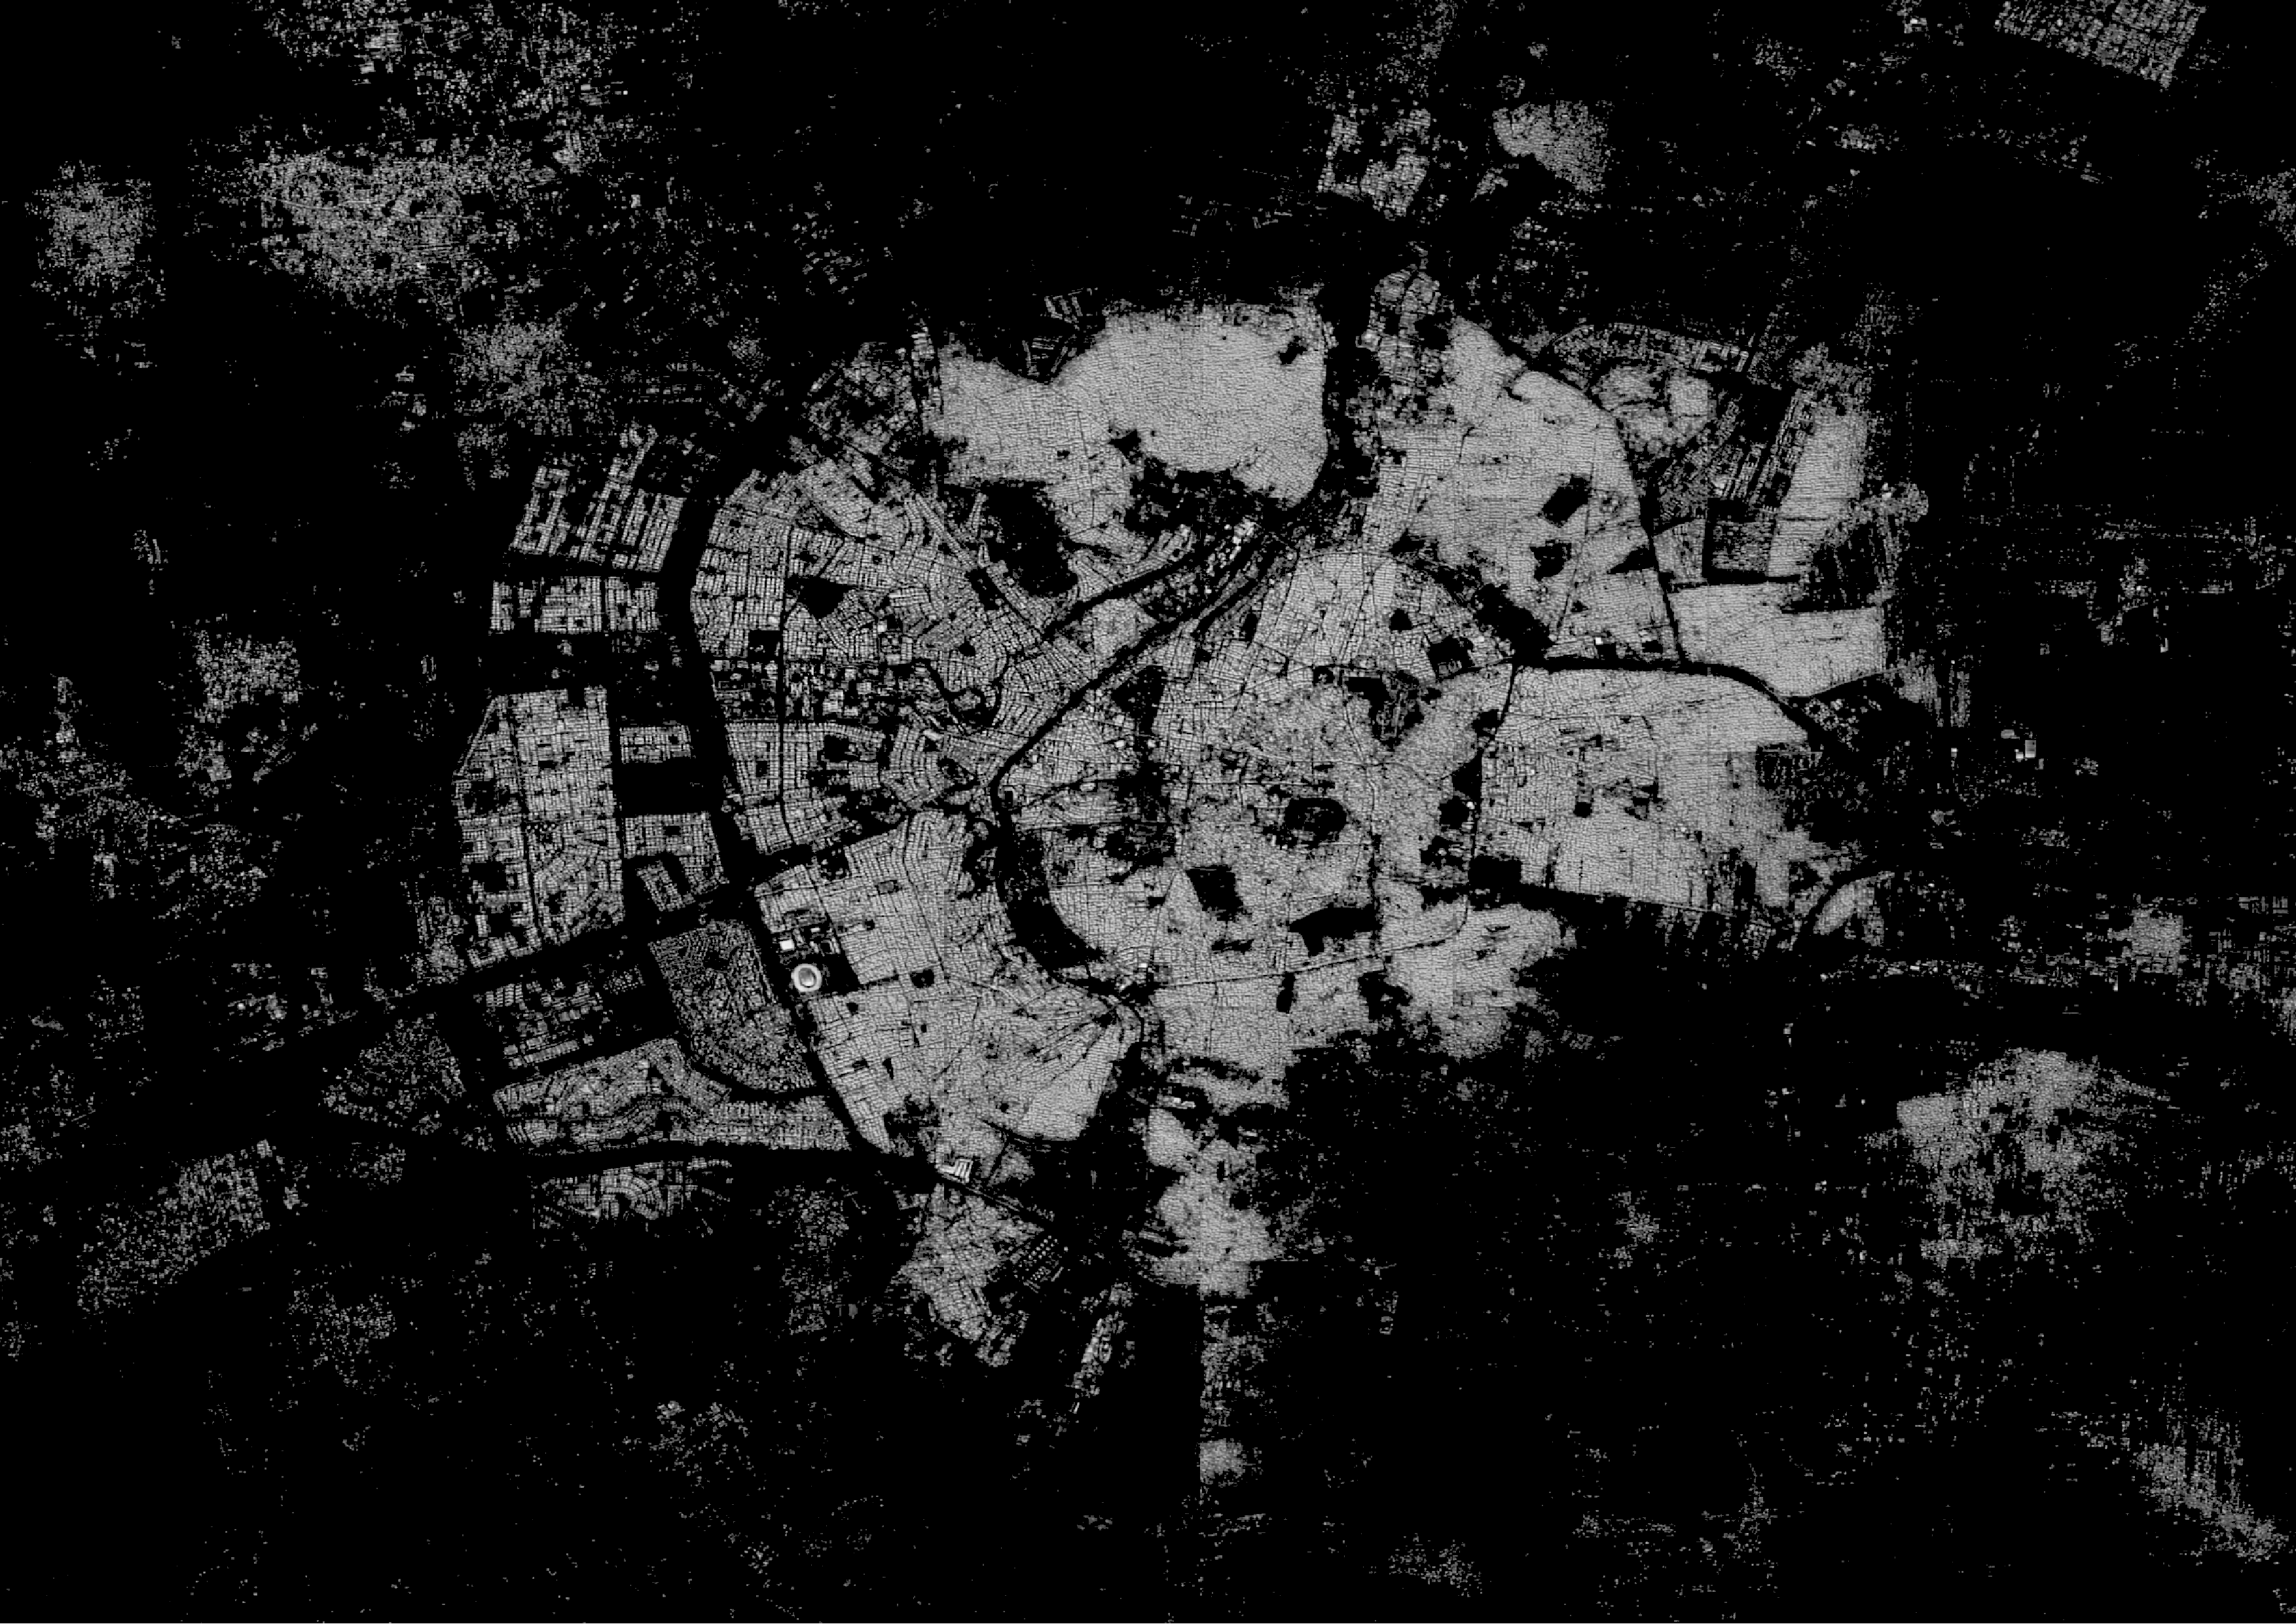
After opening the raster file in QGIS (or other Geographic Information System), the layer symbology defaults to black for values of zero, white for values of one, and a grayscale for values between zero and one (as seen in the image below).
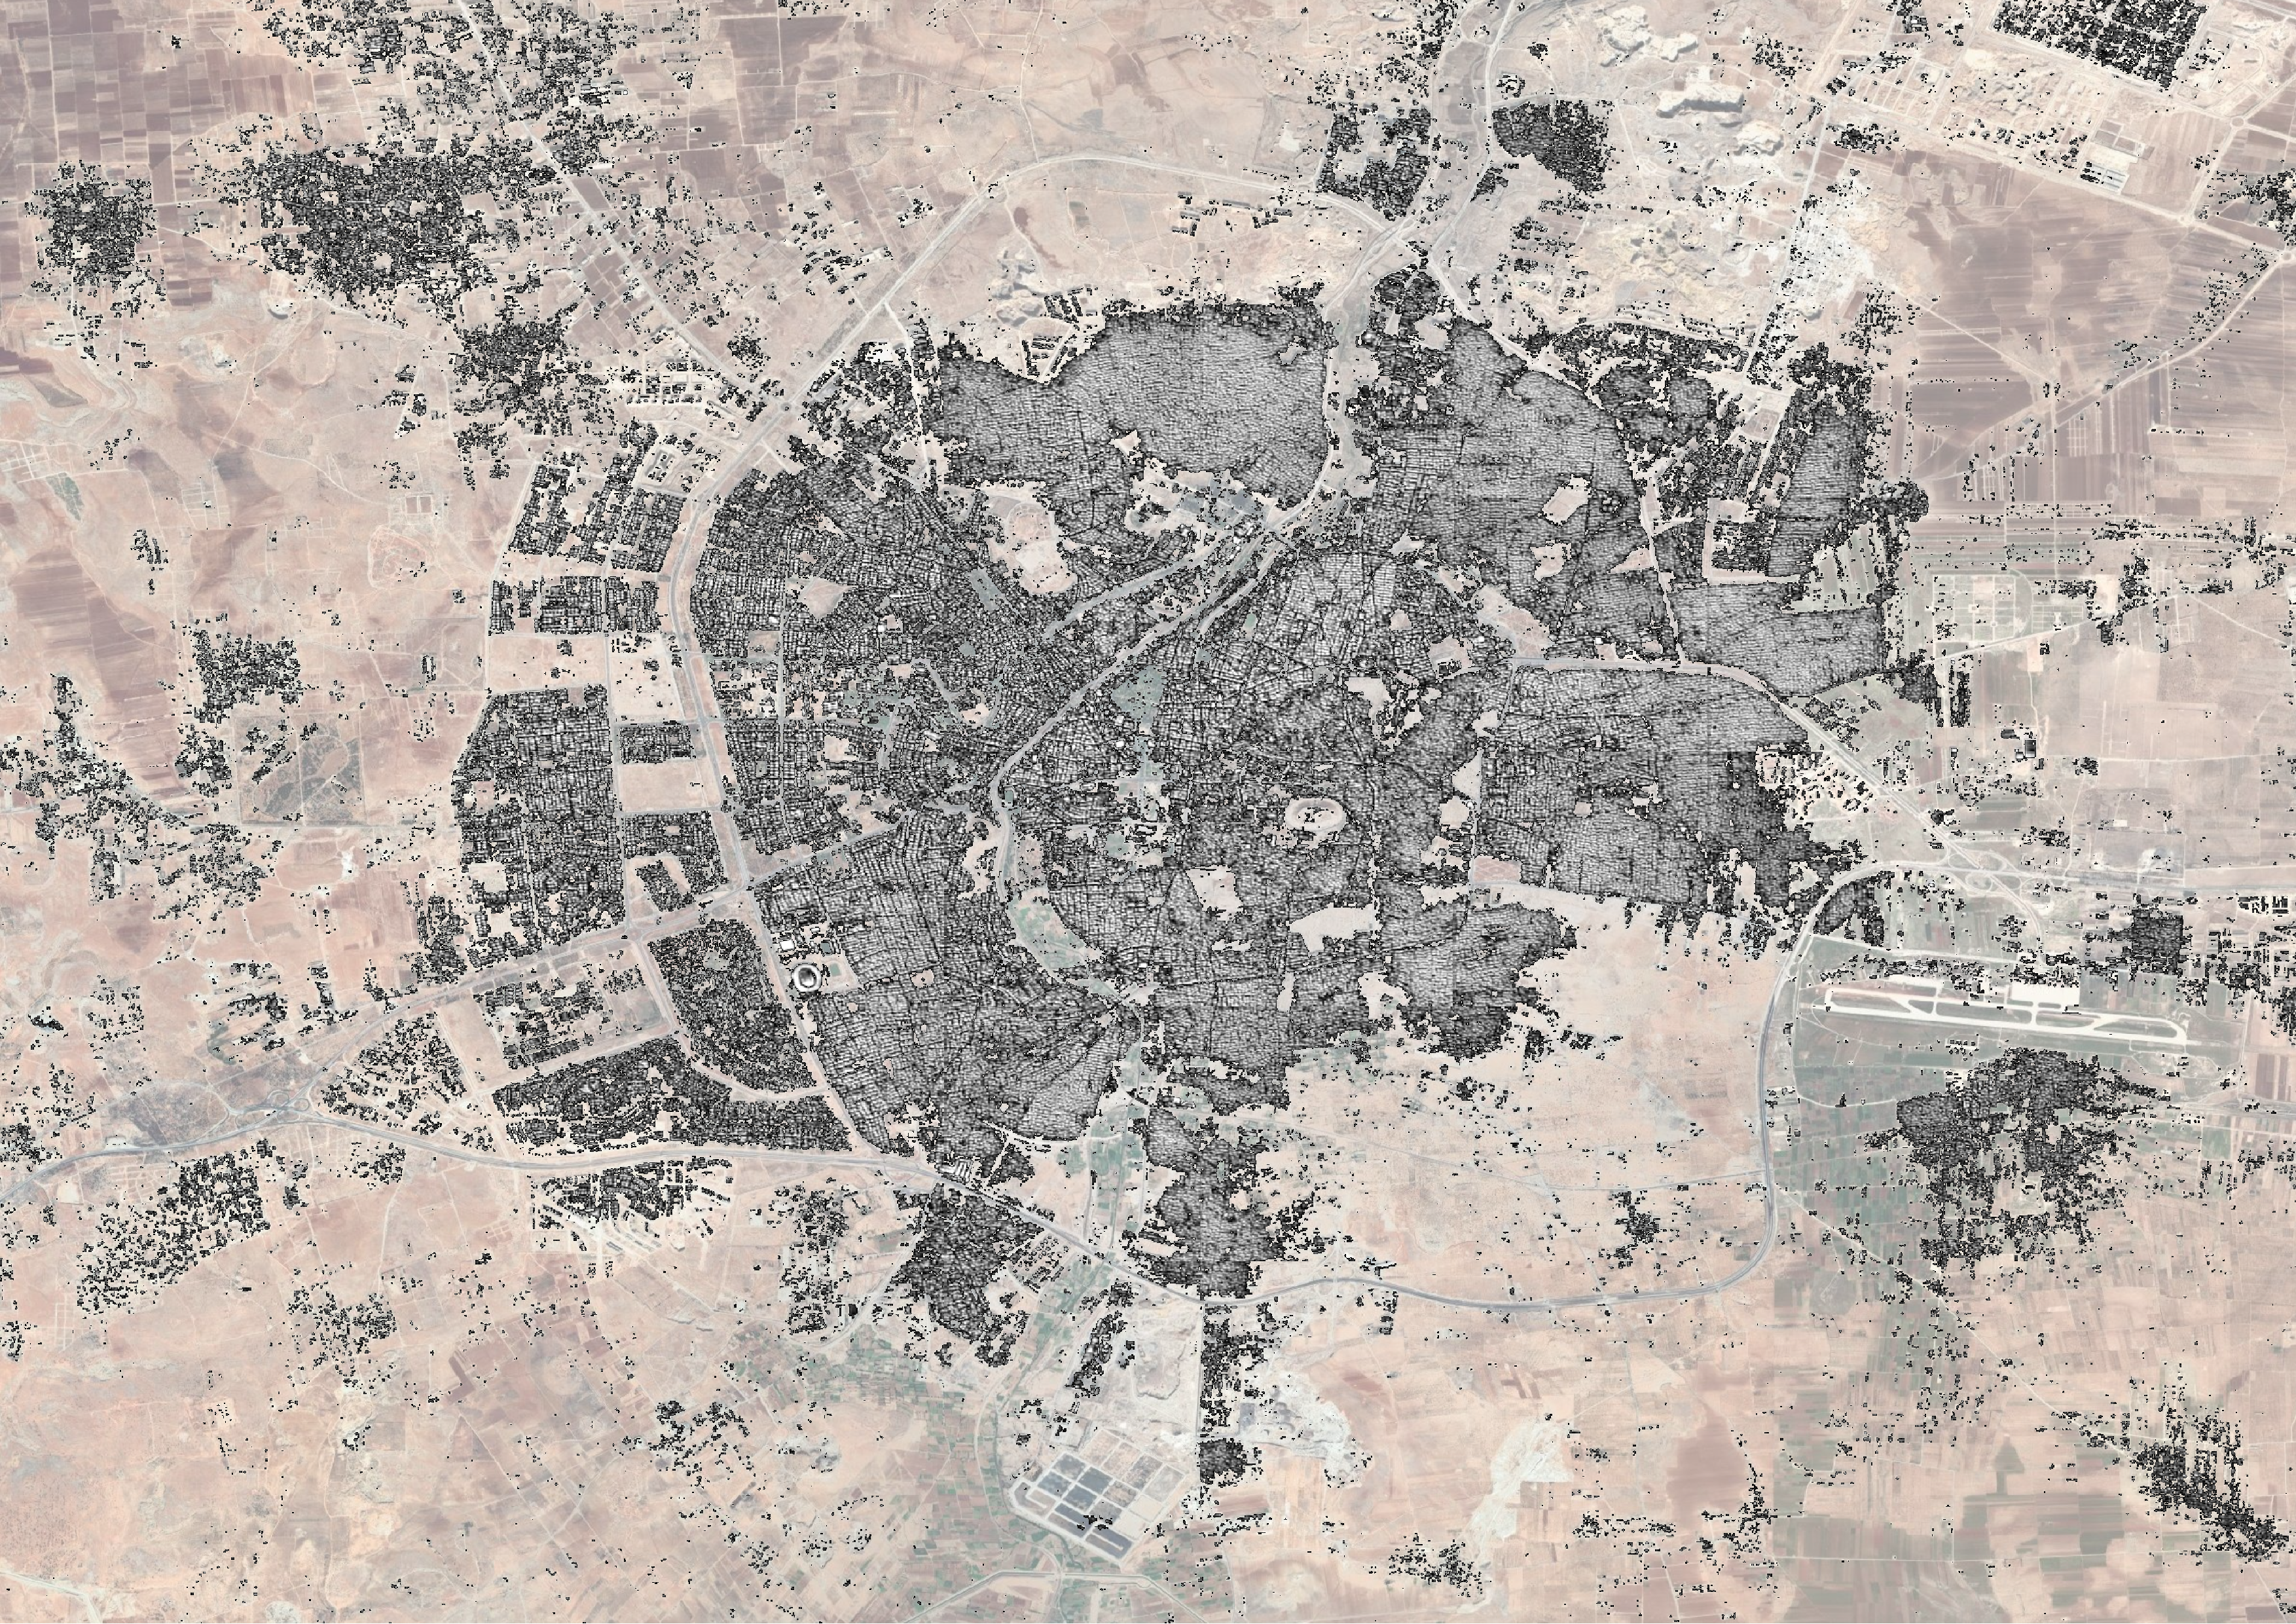
By setting 0 as an additional no data value, it is possible to view the Built Up Index layer atop satellite imagery
-
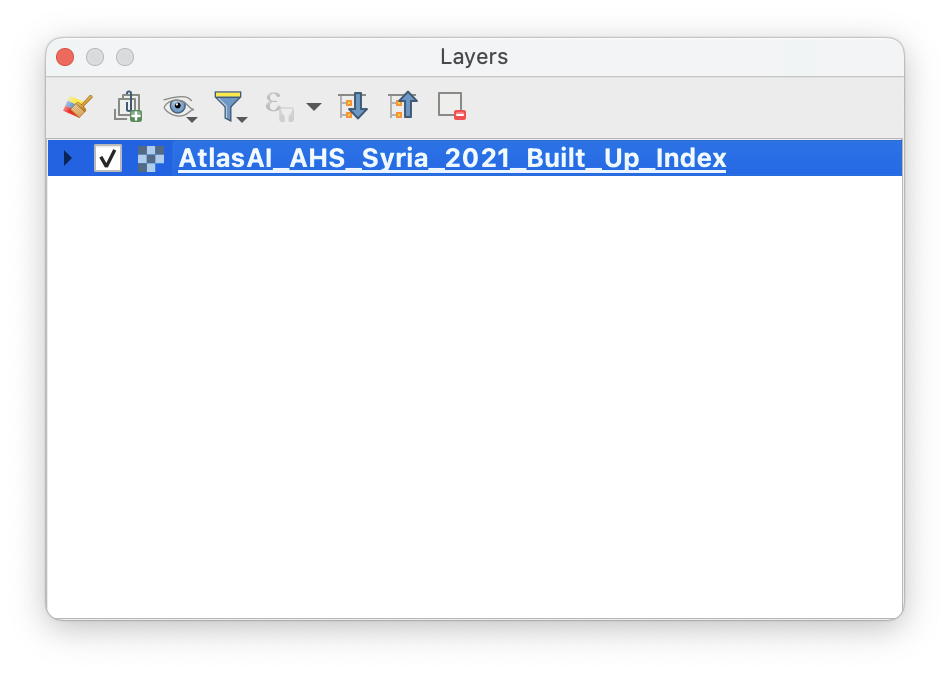
First, open the Layer Properties window by double clicking on the layer in the Layers panel
-
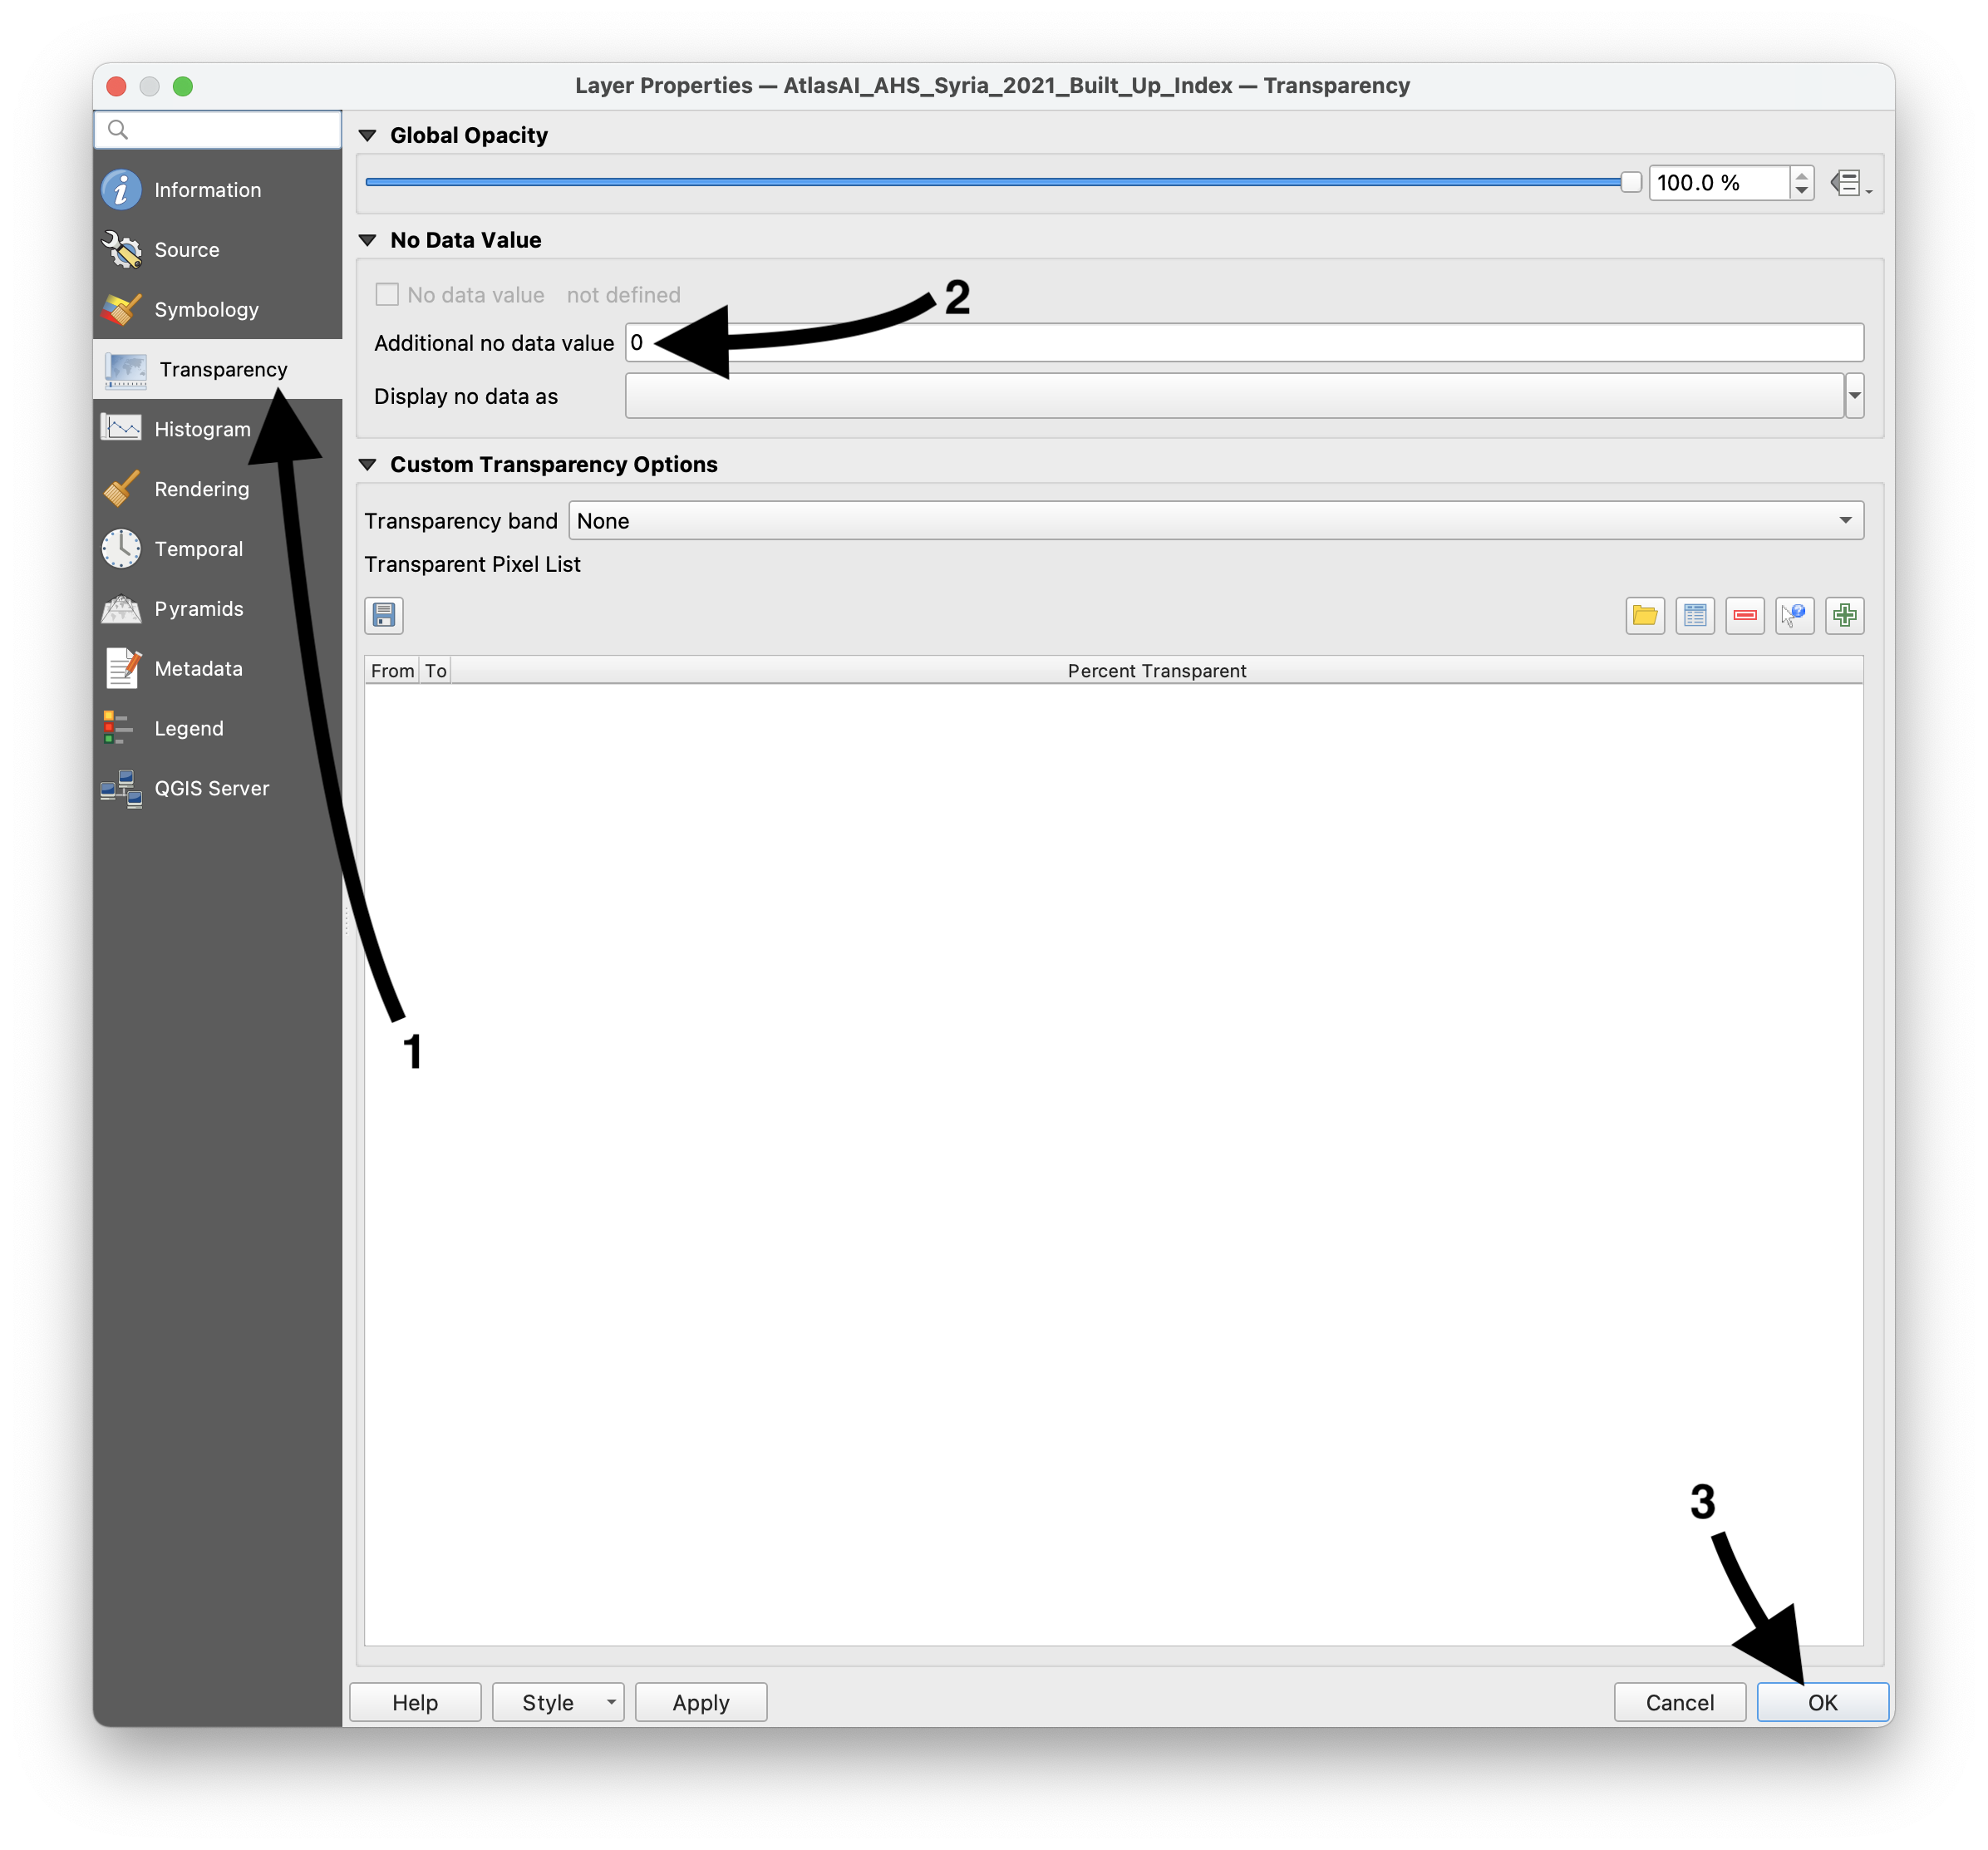
Second, open the Transparency tab (1), set "Additional no data value" to 0 (2), and click "OK" (3)
After clicking "OK" the layer symbology changes to transparent for values of zero (still with white for values of one and a grayscale for values between zero and one) allowing a satellite image layer to appear beneath (as seen in the image below).